From Confusion to Clarity: Visual Paths That Solve Problems

Join us as we explore Decision Trees and Flowcharts for Structured Problem-Solving, turning tangled questions into navigable choices and dependable actions. You will learn pragmatic techniques, engaging stories, and field-tested patterns that help teams reduce risk, communicate faster, and make confident decisions together.

Why Visual Logic Works

Cognitive Relief Through Branching Choices

Branching reduces overload by separating possibilities into digestible paths, letting the mind evaluate one slice at a time. Instead of ruminating in circles, you inspect conditions, follow consequences, and compare outcomes, steadily building clarity without sacrificing nuance or important exceptions.

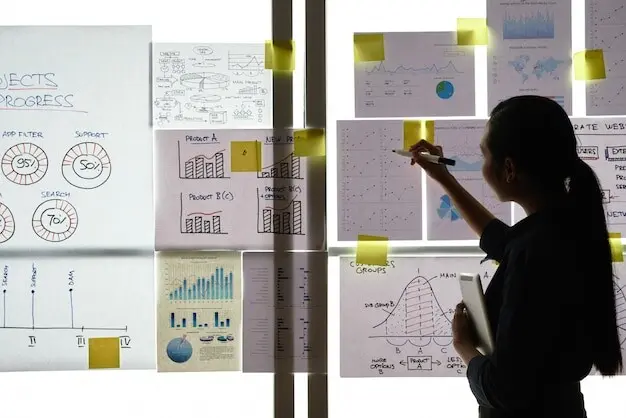
Shared Diagrams, Shared Understanding

When everyone can point to the same diagram, debates shift from opinion to evidence. Teams trace arrows, annotate uncertainties, and test ideas by walking imaginary cases. Miscommunications shrink because symbols, branches, and decision points consistently encode intent, rules, thresholds, and responsibilities.

From Abstract to Actionable

A vague problem becomes tractable when translated into explicit conditions, gateways, and end states. Unclear phrases like better quality transform into measurable criteria, deadlines, and owners. The drawing invites experiments, reveals data gaps, and turns stalled conversations into concrete, prioritized next steps.

Start with a Well-Formed Question

Great diagrams begin before any box is drawn. Clarify why the decision matters, who is affected, and what success looks like. Frame scope, time horizons, and acceptable risk, so every branch later reflects genuine priorities rather than accidental habits.

Define Inputs, Constraints, and Success

List available data sources, precision limits, deadlines, budgets, and compliance boundaries. Agree on what winning means in measurable terms, including trade-offs you are willing to accept. Clear definitions prevent endless branching and keep the diagram tethered to real-world accountability and value.

Expose Assumptions Before You Draw

Write down guesses about user behavior, system latency, costs, and exception frequency. Mark items as beliefs, not facts, until validated. By separating assumptions from rules early, you avoid embedding wishful thinking inside arrows and boxes that later masquerade as unquestioned truth.

Choose Tree or Flowchart First

Prefer a decision tree when uncertainty dominates and branching on criteria guides choices. Prefer a flowchart when sequencing steps, handoffs, or loops matters most. Both can complement each other, but starting with the dominant need accelerates clarity and simplifies collaboration.

Building Robust Decision Trees

Good trees separate signal from noise, balancing detail with readability. They segment outcomes by meaningful predictors, quantify consequences, and acknowledge uncertainty. Proper validation, pruning, and annotation prevent brittle logic, helping teams reason under pressure without collapsing into guesswork or endless debate.

Designing Flowcharts People Actually Use

A helpful flowchart removes friction, especially for newcomers and stressed responders. Consistency in symbols, readable labels, and clear routing keeps eyes moving and hands executing. Realistic exceptions, graceful exits, and brief notes prevent paralysis, enabling reliable outcomes across varied situations and roles.

Tools, Templates, and Collaboration

Software matters less than shared intent, yet the right tools remove friction. Combine rapid sketching with disciplined version control. Encourage comments, color-coded layers, and clear ownership so distributed teams co-create diagrams that evolve gracefully, remain trusted, and survive leadership changes.

From Diagram to Decision

Run Better Meetings With Visual Agendas

Structure discussions around branches and flows instead of wandering status updates. Start at inputs, traverse decisions, and end at outcomes with timeboxed checkpoints. People leave knowing who does what next, which risks remain, and how success will be measured.

Measure Results, Update Branches

Collect outcome data, compare it against expectations, and revise thresholds or paths accordingly. When conditions shift, the diagram should change faster than habits. Small, frequent adjustments keep processes resilient, while archived versions preserve learning and justify regulatory or executive reviews.

Invite Feedback and Keep Learning

Ask readers to comment, propose branches, or share real incidents where the current logic struggled. Encourage subscriptions, replies, and case studies from diverse roles. Community input strengthens diagrams, surfaces blind spots, and sustains momentum long after initial enthusiasm fades.
Lentolumadaritavonarivelto
Privacy Overview

This website uses cookies so that we can provide you with the best user experience possible. Cookie information is stored in your browser and performs functions such as recognising you when you return to our website and helping our team to understand which sections of the website you find most interesting and useful.