
Conversations in Motion: Collaborative Design with UML Sequence Diagrams
Together we explore how UML and Sequence Diagrams for Collaborative Software Design transform scattered ideas into clear, testable interactions that teams can trust. Expect pragmatic techniques, relatable stories, and visual patterns that reduce ambiguity, accelerate delivery, and invite discussion. Share your toughest workflow, and we will sketch, question, and iteratively refine it into something everyone understands.


Lifelines, Messages, and Meaning
Participants appear as lifelines stretching downward through time, where messages travel as arrows that tell a story about responsibility, causality, and intent. Activation bars highlight work being done, while returns and notes capture outcomes and rationale. Clear, consistent naming keeps mental models aligned across shifting teams and busy schedules.

Calls, Returns, and Time’s Subtle Direction
Reading left to right and top to bottom reveals a gentle chronology: synchronous calls block the caller until a reply arrives, while asynchronous messages let work continue and answers surface later. Showing returns, callbacks, or events clarifies ownership, latency expectations, failure handling, and who must reconcile partial progress when surprises strike.
From User Story to Interaction Narrative
Begin with a small promise expressed as a user story, then ask what must happen between people and software to keep that promise under pressure. Sequence diagrams reveal dependencies, surface missing responsibilities, and translate acceptance criteria into observable messages that testers, developers, and product partners can verify together across environments.


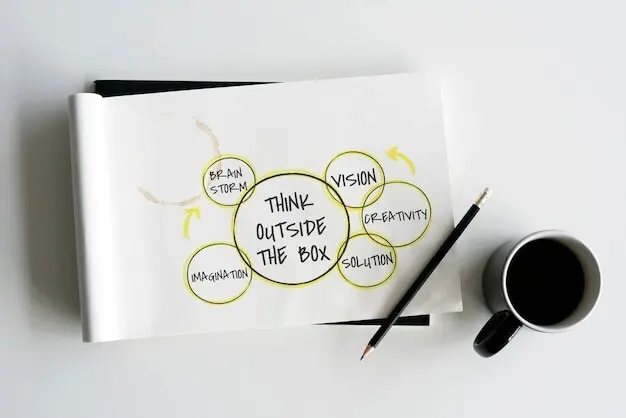
Lightweight Sketching Before Heavy Detail
Use thick markers, big shapes, and forgiving language early. Invite questions like who starts this, what if that fails, and how do we know it worked. By delaying precise names and protocols, teams discover better boundaries and metrics before optimization or tooling freezes the wrong structure in place.
Text-Based Diagrams for Version Control
Represent interactions as code using PlantUML or Mermaid to unlock branching, pull requests, reviews, and continuous integration checks. Small, readable diffs invite constructive feedback. Automated exports generate consistent images for documentation, ensuring the diagram people discuss always matches the artifact developers maintain, release after release, sprint after sprint.
Connecting Interactions to Structure
Great interactions rest on honest structure. Link each message to an operation, endpoint, or handler, and ensure components, classes, and deployment nodes exist to perform the work. This alignment turns pictures into contracts, supports onboarding, and prevents invisible complexity from hiding in heroic singletons or unowned background jobs.

From Messages to Interfaces
Each call implies an interface. Write it down. Align names in diagrams with names in code, repositories, or API specs like OpenAPI and AsyncAPI. Define payloads, status codes, and error semantics early so expectations harden into reliable behavior rather than drift into accidental, fragile coupling later.
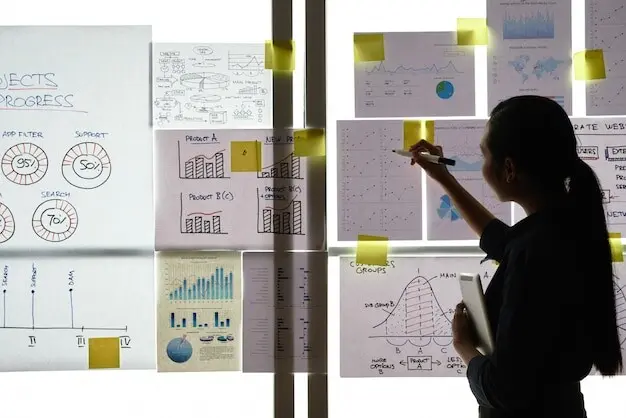
Architecture Views That Stay Consistent
Keep component, class, and deployment views synchronized with interaction stories. If a sequence mentions a worker, a scheduler, or a cache, verify it exists in structure diagrams and production. Missing pieces signal gaps, while extra boxes without messages suggest dead weight or responsibilities waiting to be clarified.
Nonfunctional Realities, Explicitly Modeled
Model latency budgets, timeouts, retries, idempotency keys, and backpressure with notes or dedicated fragments. Show circuit-breaker trips and recovery, not just sunny-day paths. Annotate correlation identifiers to support tracing. These details anchor expectations, reveal costs, and make reliability a first-class citizen rather than a footnote discovered during incidents.
Avoiding Traps and False Precision
Precision is valuable, but premature detail can silence discovery. Overcrowded lifelines, pseudo-code, and unexamined edge cases turn diagrams into cluttered commitments. Keep audiences, decisions, and deadlines in mind. Prefer readable intent over exhaustive notation, and keep refining as feedback arrives, so complexity emerges only where it truly matters.
Abstraction That Serves Decisions
Decide what must be clear to move forward today, and hide the rest behind well-named participants or notes. Skip UI minutiae, vendor quirks, and speculative steps until they influence tradeoffs. Show enough structure to choose confidently, not so much that exploration becomes negotiation with yesterday’s sketch.

Keeping Names Honest
Choose names that reveal responsibility and domain intent. Avoid catch-all managers or god services that hide unrelated behavior behind friendly façades. When a participant gains too many reasons to change, split it, rename both parts, and redraw messages so ownership and cognitive load become kinder, smaller, and clearer.

Living Diagrams, Not Wall Art
Treat every diagram like code: reviewed, versioned, and tested against reality. Add links from pull requests, tickets, and runbooks. When production changes, update the picture. Schedule small maintenance moments so new colleagues trust diagrams as current truth, not inspirational posters fading quietly beside forgotten whiteboards.
From Picture to Production
Good diagrams influence code, tests, and operations. Translate messages into interfaces, automate contracts, and verify outcomes with observability. Generate sequence views from live traces to compare design and reality. Share findings broadly, invite critique, and keep improving so collaboration remains a habit, not an emergency response during outages.
Executable Specifications and Tests
Express scenarios with clear Given, When, Then steps, and map each observable transition to a message. Support them with contract tests and schema validation to prevent silent drift. Simulate failures early, watch retries, and confirm idempotency so behavior under stress matches expectations communicated to stakeholders and customers.
Observability That Draws Itself
Instrument services with traces, spans, and events using standards like OpenTelemetry. Correlate identifiers across boundaries so a single request paints its own interaction. Export sequence diagrams from trace data, compare against intended flows, and create follow-up tasks when reality diverges, transforming surprises into incremental learning rather than escalating firefights.